Spherical graphite should not be qualified by appearance alone. Spheroidization changes particle architecture, and that change can affect packing, tap density, particle-size distribution, surface area, handling, coating behavior, and the way a material enters electrode processing. A visually rounded powder can still contain a problematic coarse tail, an excessive fine fraction, an unstable surface condition, or a lot-to-lot change that matters more than the headline shape.
The current Chinese product reference GB/T 24533-2019, Graphite negative electrode materials for lithium ion battery, is used here only to anchor product-category terminology; particle-shape and PSD acceptance still come from the qualified electrode and cell process. Particle-size analysis can also be anchored to GB/T 19077-2024, Particle size analysis—Laser diffraction methods. Those standards provide method and product context; the buyer still has to define which particle window is qualified for the intended electrode process.
This article focuses on three linked powder questions—shape, tap density, and PSD—without turning them into one score. BET surface area is discussed only where it helps explain the particle system; the dedicated BET surface-area guide covers that parameter in depth.
Why Spheroidization Changes More Than Particle Appearance
Spheroidization changes more than particle appearance because shaping alters how particles occupy space, present surface, distribute by size, and interact during handling and electrode processing.
Natural flake graphite begins with a plate-like particle architecture. Shaping processes reduce sharp aspect features and create a more compact particle form, while classification removes or separates material produced during the shaping step. The final powder is therefore the result of both geometry change and size-fraction control.
Spheroidization can move several properties at once: particle roundness, packing, tap density, fine fraction, and gas-accessible surface area. Classification and later surface treatment can shift the packing again.
Define a spherical graphite grade with data, not a photograph or shape adjective. One attractive micrograph cannot represent the lot, while a less visually perfect powder may still reproduce the qualified electrode process.
Note: “Spherical” is a useful route and morphology descriptor, but it is not a substitute for PSD, packing-related data, surface-area data, chemistry, and electrode qualification.
Particle Shape: What to Observe and How to Describe It
Particle shape should be described through repeatable features that matter to the process, not through subjective labels such as “good sphere” or “poor sphere.”
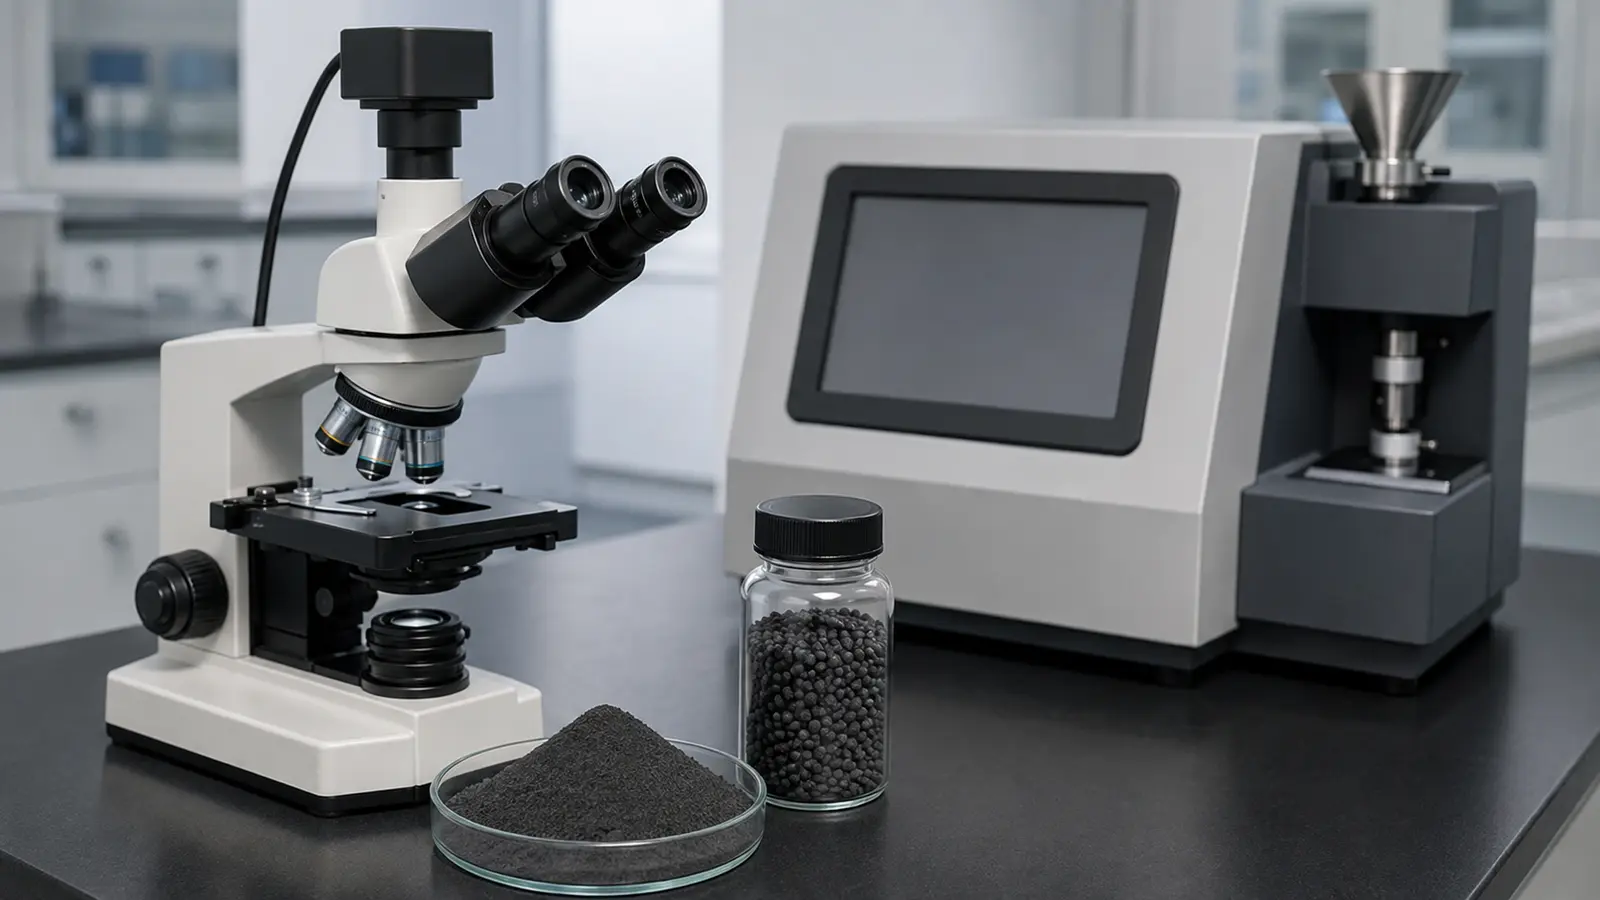
Useful observations can include roundness or sphericity trends, residual plate-like particles, angular fragments, satellite fines attached to larger particles, broken particles, agglomerates, and the consistency of the population across several fields of view. The exact image-analysis method can vary, but sample preparation and field selection should be controlled if the buyer intends to compare lots.
Microscopy is strongest as qualification and diagnostic evidence. One image cannot represent a large powder lot, so a purchasing specification should avoid hard acceptance language based only on an attractive micrograph. If morphology must be contractual, define the observation method, sampling basis, and feature being judged.
Shape also needs to be interpreted with PSD. A population that appears rounded at the central size can still contain coarse or fine tails with very different morphology. If those tails affect slurry, packing, or coating behavior, the buyer should control them separately.
The natural-versus-synthetic route question belongs elsewhere. Synthetic graphite can also be engineered into different particle architectures, and natural graphite can be shaped extensively. The natural versus synthetic graphite anode guide compares route families without assuming one morphology for each.
Tap Density as a Packing Metric
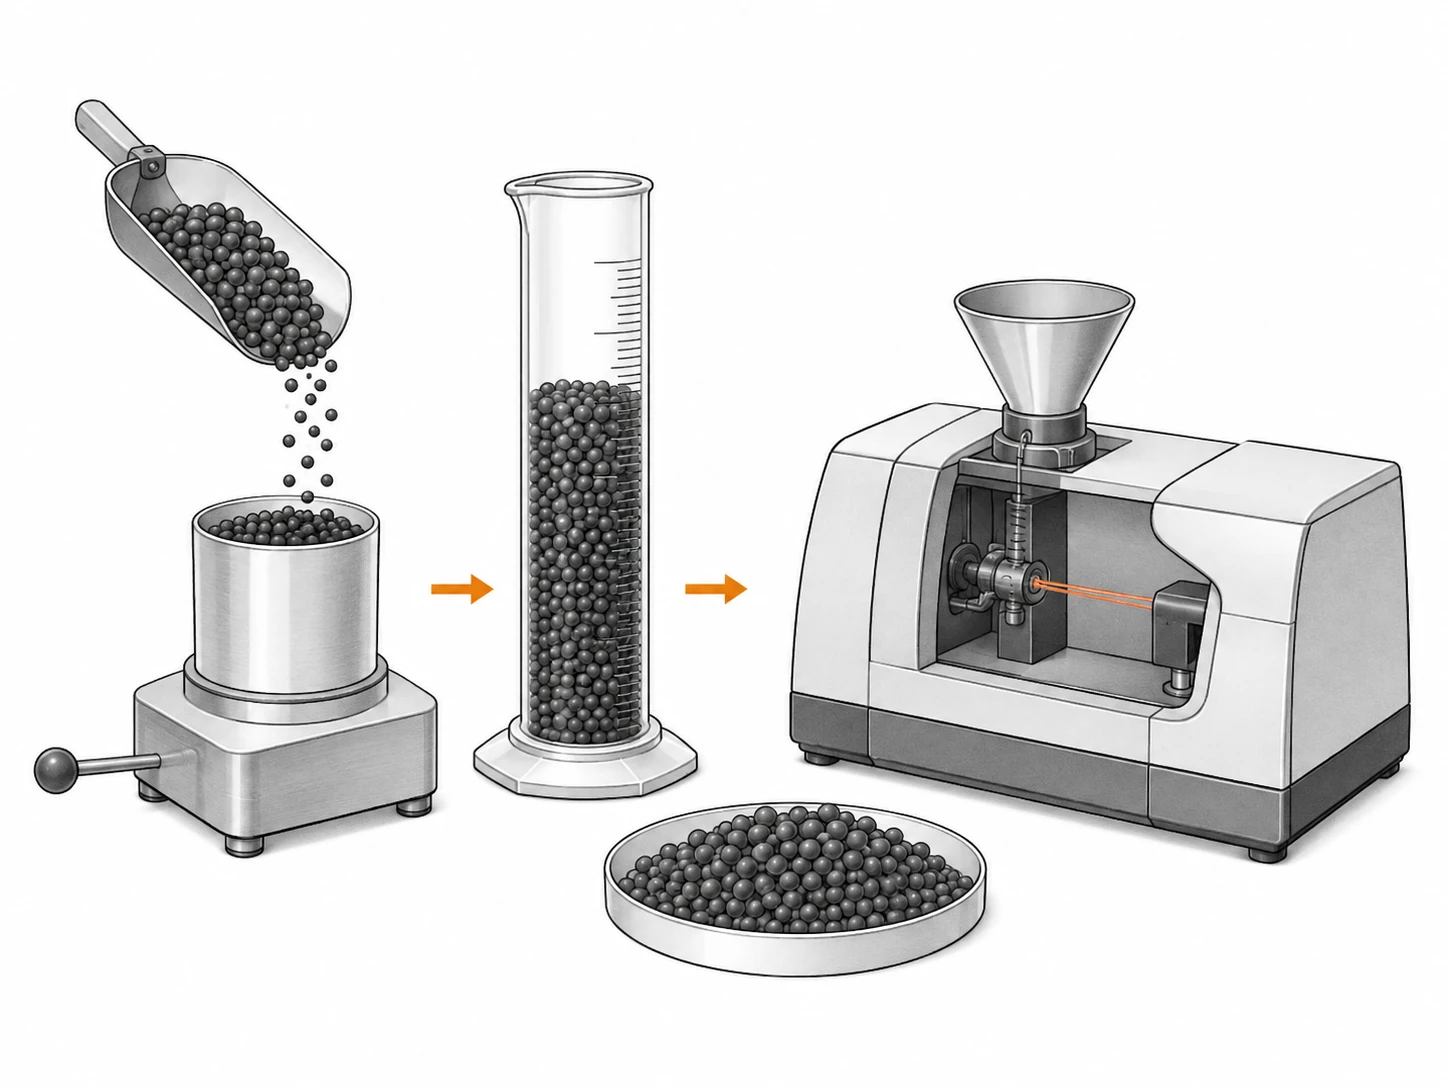
Tap density is a packing metric that describes how a powder occupies volume after a defined tapping procedure; it is useful for comparing powder packing but should not be equated with final electrode density.
The result is influenced by particle shape, size distribution, surface friction, agglomeration, and the method itself. A more rounded particle population may pack differently from a highly plate-like one, but shape is only one contributor. A broad distribution can sometimes fill voids differently from a narrow distribution, and fines can either assist packing or increase cohesion depending on the system.
For qualification, record the method and sample state. A tap-density value from one supplier should not be compared directly with another if the apparatus, tapping condition, sample preparation, or reporting basis differs materially. Use the same method or establish a bridging relationship.
The most important boundary is between powder packing and electrode structure. Electrode density is created through slurry formulation, coating, drying, calendaring, particle deformation and rearrangement, binder distribution, porosity control, and other process variables. Tap density can support interpretation, but it does not set the finished electrode density by itself.
Caution: Do not specify the highest available tap density as a universal purchasing target. A tighter or higher value is useful only when the buyer has shown that it supports the qualified electrode process without introducing another failure.
PSD: Control the Center and the Tails
PSD should control the central particle population and the tails because a single D50 can remain stable while the coarse or fine fractions change enough to affect handling, slurry, coating, or packing.

D50 describes the median point of the measured volume distribution under the stated method. D10 and D90 or other selected percentiles add information about the distribution width, but they still need to be interpreted with the full curve, sample preparation, and the application. The exact set of contractual percentiles should come from qualification evidence.
Coarse particles can affect coating surface, local film thickness, narrow gaps, or particle distribution within the electrode. Excessive fines can change accessible surface, binder or liquid demand, viscosity, dusting, agglomeration, and packing. The tails can therefore cause different failure modes even when the median looks unchanged.
Laser diffraction is widely useful, but the result depends on sample dispersion and analysis conditions. Weak agglomerates may break during preparation; strongly agglomerated material may be reported as larger particles. A buyer should preserve the qualified preparation method and avoid treating a method change as a material change without an overlap comparison.
The micronized graphite PSD guide explains method and tail interpretation at a general graphite-powder level. For spherical anode material, the additional question is how the measured distribution interacts with the shaped particle architecture and electrode process.
Connect Shape, Tap Density, and PSD Without Treating Them as One Number
Shape, tap density, and PSD should be connected as related observations, but none should be used as a mathematical substitute for the others because each describes a different aspect of the powder.
Shape describes geometry. PSD describes the measured size population under the agreed method. Tap density describes packing after a defined mechanical procedure. A change in shape can move tap density; a change in PSD can also move tap density; and a classification change can move PSD while leaving the central morphology similar. The buyer needs the combination to understand the mechanism.
| Observed change | Possible interpretation | Next check |
|---|---|---|
| Tap density changes, PSD stable | Morphology, agglomeration, surface condition, or method may have shifted. | Compare microscopy, sample state, and method execution. |
| D50 stable, D90 increases | Coarse tail increased. | Check coating or classification-related risk. |
| Fine fraction increases | Shaping/classification or breakage state may have changed. | Check BET, slurry behavior, and retained sample. |
| Shape appears stable, tap density falls | PSD, surface friction, agglomeration, or test condition may differ. | Review distribution curve and test basis. |
| All three remain stable but electrode drifts | Another powder or process variable may be responsible. | Check surface treatment, chemistry, moisture, binder, mixing, coating, and calendaring. |
If a new lot changes electrode processing, compare it with a retained approved lot using the same morphology, PSD, tap-density, and surface-area methods. The pattern across measurements is more informative than one outlying number.
Do not make every measured parameter contractual. Promote a field to a release limit only after it consistently predicts application risk.
Sampling deserves its own control because a shaped graphite lot can segregate during filling, transport, or transfer. If a broad particle population separates by size or density-related handling behavior, a laboratory portion taken from one convenient location may not represent the delivered package. Qualification records should therefore state how the sample was taken and reduced, especially when the buyer is setting tight tail or packing limits.
Scale-up can expose handling effects that a laboratory jar does not: conveying, storage, transport vibration, and repeated transfer can change agglomeration and bulk state. Include realistic packaging and handling when the candidate is close to the edge of the process window.
Change control should preserve the particle architecture that was actually qualified. A supplier change to shaping equipment, classification settings, surface treatment, blending, or another critical step may not immediately move every headline COA field. The buyer should therefore define which process changes require notification even if the supplier expects the finished material to remain inside specification.
Use Shape, Tap Density, and PSD as a Candidate Triage System
Shape, tap density, and PSD are most useful as a triage system: they tell the buyer whether a spherical-graphite candidate is internally consistent enough to justify deeper qualification. Matching one or two headline values is not enough. The three measurements should be read together with material identity and surface-treatment status before the candidate moves into an electrode trial.
| Triage check | Evidence needed | Proceed when | Hold and investigate when |
|---|---|---|---|
| Material identity | Natural/synthetic route, shaping status, coating or other modification, lot ID | The supplied state matches the candidate that was requested. | A coating, blend, shaping step, or lot identity is unclear. |
| Morphology population | Representative microscopy under controlled preparation, not one showcase image | Population is consistent with the approved/reference particle architecture. | Residual platelets, fragments, satellites, agglomerates, or field-to-field variation change materially. |
| PSD center and tails | Comparable method plus selected central and coarse/fine-tail metrics | The distribution remains inside the qualified screening window. | D50 appears stable while D10/D90 or another critical tail shifts. |
| Packing response | Tap density or agreed packing metric with method and sample state | Packing is consistent with the morphology/PSD evidence and historical process. | Packing shifts without an explained change in PSD, morphology, or method. |
| Surface state | Coating/modification identity; BET or chemistry only where used by the program | No unreviewed surface-treatment change is present. | Shape and PSD match but surface-sensitive process behavior changes. |
| Electrode entry | Lot-specific powder evidence and retained sample | Candidate differences are known and the trial can isolate them. | Several uncontrolled material differences would enter the electrode trial together. |
BET surface area is a supporting field rather than a fourth headline score. GB/T 19587-2017 is the current Chinese national reference for measuring solid specific surface area by gas adsorption using the BET method. Use BET when it helps explain a change that shape, PSD, or packing evidence does not resolve—especially when fines, roughness, porosity, or surface treatment may have changed. Do not use it to overrule a stable particle system or to predict cell performance by itself.
Selected chemistry and impurity fields may matter according to the buyer’s battery system and supplier controls. Moisture may matter for handling and process sensitivity. Surface treatment or coating should remain part of the material identity. Bulk or flow behavior can matter at scale. The supplier’s change-control record helps protect the qualified architecture.
The final qualification stage is the electrode and cell trial. The graphite anode material qualification guide shows how to move from powder screening through controlled electrode and cell evidence. Spherical graphite should not be declared equivalent simply because the three headline powder metrics match.
After the candidate passes triage, the minimum data package for electrode entry can include:
- Material family and modification identity.
- PSD with agreed method and selected central/tail metrics.
- Morphology evidence under a repeatable preparation method.
- Tap density or another qualified packing-related metric.
- BET surface area with agreed method.
- Moisture and selected chemistry fields where application-relevant.
- Lot-specific COA and retained sample.
- Supplier change-notification scope.
- Controlled electrode and cell qualification evidence.
Decision rule: qualify spherical graphite as a particle system, not as a shape adjective. Shape explains geometry, PSD explains population, tap density explains method-defined packing, and their agreement determines whether the powder evidence is coherent enough to enter the next gate. The electrode/cell trial still decides whether the combined system works.
For an RFQ to QDZRT Graphite, provide the material family being considered, target PSD or current qualified distribution, morphology expectations where documented, tap-density and BET fields if they are part of the qualification basis, chemistry restrictions, sample quantity, and the electrode stage the material will enter. If a value is only an exploratory target, identify it as such rather than presenting it as a universal battery-industry limit.
That approach keeps the specification flexible enough for real material development while preserving the data needed for repeat supply. Spherical graphite is useful because shaping can create a different particle architecture; qualification is successful only when that architecture remains measurable, reproducible, and compatible with the buyer’s electrode process.
For repeat orders, use the same material and test vocabulary across suppliers so proprietary grade names do not hide differences in route, coating, PSD, or packing data.
Another useful qualification check is the relationship between particle statistics and the actual microscopy population. If the PSD curve shifts but the micrographs look unchanged, the team should ask whether sample dispersion, agglomeration, or classification changed. If morphology changes visibly while the main PSD percentiles remain similar, shape analysis and tap density may explain the difference better than D50. The purpose is not to force all measurements to agree; it is to understand which measurement is sensitive to which part of the material architecture.
Production sampling should also be designed around the possibility of segregation. A spherical graphite lot can contain a range of particle sizes, and repeated transfer or vibration may redistribute fractions within a package. If a process is sensitive to the fine or coarse tail, sampling only the top of one container can give false confidence. During supplier qualification, use a representative sampling plan and keep enough retained material to repeat the comparison if an electrode trial later produces an unexpected result.
Control surface treatment separately from particle shape. Two spherical graphites can look similar by PSD and microscopy while different coatings change BET, wetting, slurry behavior, or first-cycle response. Record the modification state as part of the material identity.
References and Sources
- National Standard Information Public Service Platform — GB/T 24533-2019, Graphite negative electrode materials for lithium ion battery.
- National Standard Information Public Service Platform — GB/T 19077-2024, Particle size analysis—Laser diffraction methods.
- National Standard Information Public Service Platform — GB/T 19587-2017, Determination of the specific surface area of solids by gas adsorption using the BET method.