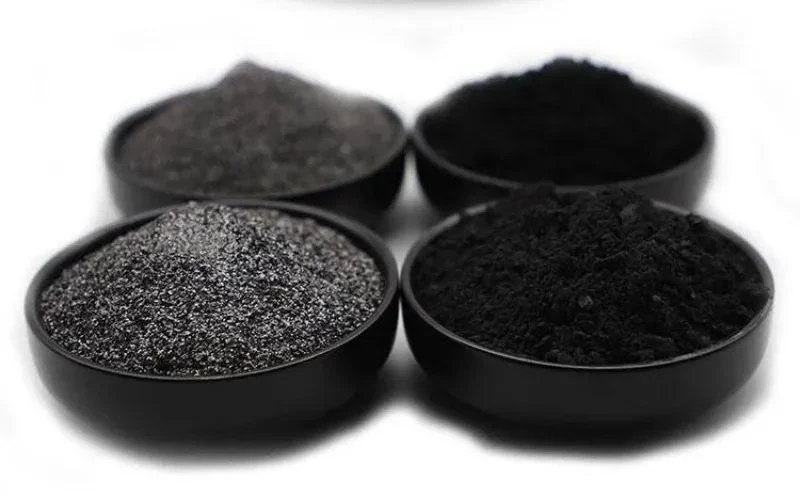
A natural-versus-synthetic graphite anode decision should begin with the cell and manufacturing requirements, not with a claim that one route is inherently superior. Both material families can be engineered into lithium-ion battery anode products, and both can vary substantially within their own category. The useful comparison is therefore between qualified material architectures under controlled electrode and cell conditions.
GB/T 24533-2019, Graphite negative electrode materials for lithium ion battery, is the current Chinese national product reference for this material category. It provides a product-level framework, but it does not remove the buyer’s need to define the cell, electrode process, candidate data package, and qualification plan.
The broader battery-grade graphite anode materials route map separates natural, synthetic, modified, and blended systems. Here the scope is narrower: compare one natural candidate and one synthetic candidate against the same cell, process, and evidence requirements.
Compare Routes Only After Defining the Cell and Process Requirements
Natural and synthetic graphite should be compared only after the buyer defines the cell design, electrode process, and qualification objective, because a route that fits one system may not fit another.
Choose the comparison mode before comparing the routes. A drop-in second source, a new cell-development program, and a cost/supply migration are different engineering questions; mixing them produces misleading route conclusions.
| Comparison mode | What must stay fixed first | What may be optimized later | What counts as success |
|---|---|---|---|
| Drop-in second source | Existing formulation, electrode process, cell design and acceptance plan | Little or none until baseline equivalence is understood | Candidate reproduces the qualified process and cell result inside the accepted window. |
| New material development | Initial comparison protocol and measurement basis | Binder, loading, calendaring or other route-sensitive process variables after baseline | Each route is judged at a documented optimized state under the project’s final criteria. |
| Cost / supply migration | Minimum performance and manufacturability gates | Process changes whose cost and requalification burden are explicitly counted | Total manufacturing and supply benefit remains positive after technical consequences are included. |
For the first baseline comparison, freeze the variables required by the selected mode: active-material loading basis, binder system, conductive additive strategy where used, mixing route, coating equipment, drying, calendaring, electrode-density basis, formation protocol, cell format, and test plan. The record can remain confidential; its purpose is to show which variables were intentionally held constant and which were allowed to move.
Caution: A supplier data sheet can show useful powder differences, but it cannot answer whether a natural or synthetic material is better for the buyer’s electrode. That answer requires controlled electrode and cell evidence.
Define the word “equivalent” before testing. Analytically similar means selected powder fields align on comparable methods. Process-equivalent means the candidate runs inside the accepted electrode-manufacturing window. Application-equivalent means it also meets the defined cell criteria. A second source does not need numerically identical powder data when the buyer has demonstrated process and application equivalence, but matching headline data alone cannot establish either one.
Processing Route and Particle Architecture
The natural and synthetic routes create different process histories, but the buyer should translate those histories into measurable particle architecture instead of assuming the route name predicts the final material.
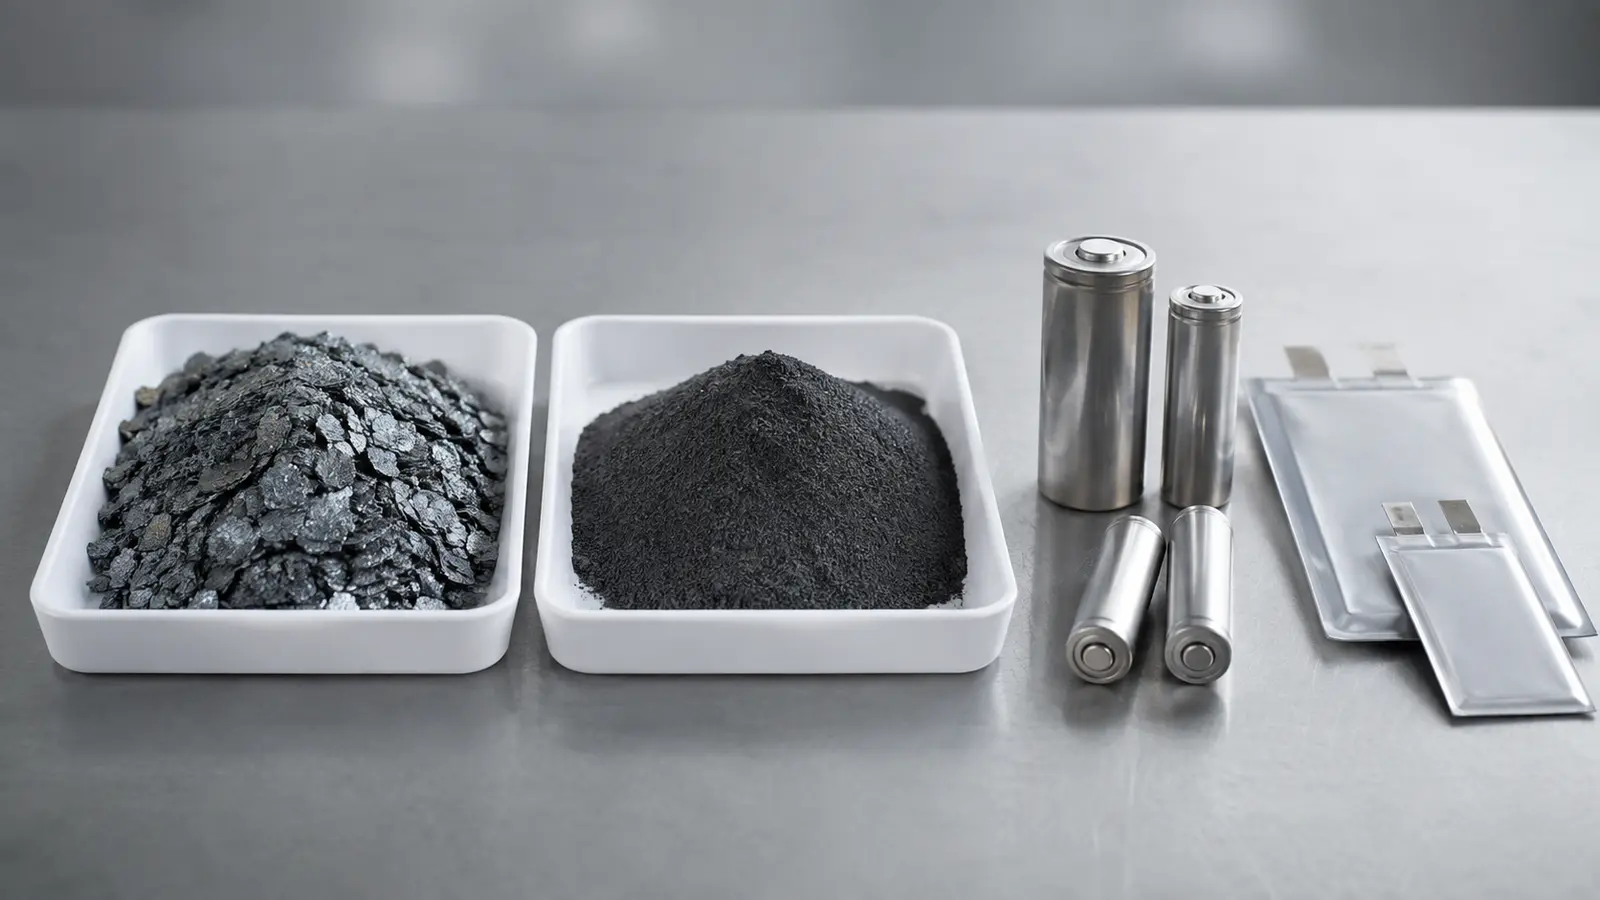
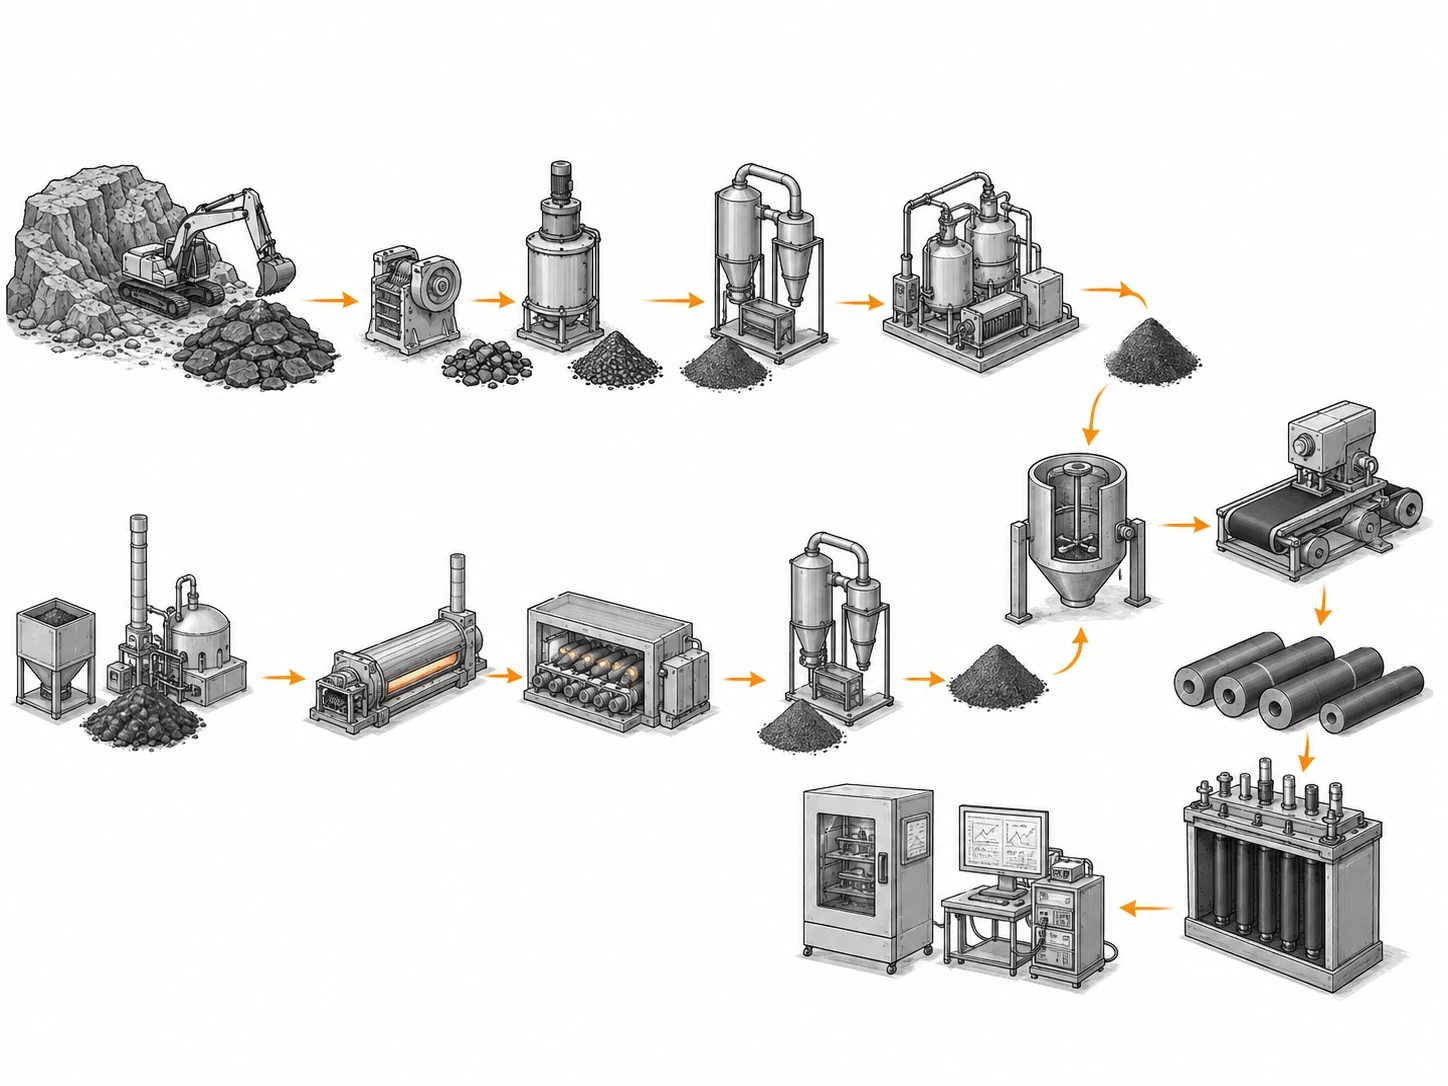
A natural candidate normally starts with mined flake, then moves through concentration and purification, controlled sizing, and—when required—spheroidization or other surface work. A synthetic candidate starts from a carbonaceous precursor, with graphitization followed by milling, classification, and finishing. Coating or blending may be applied later to either route, so route name alone still does not define the final particle architecture.
These different histories can produce different morphology, particle-size distributions, packing behavior, surface area, impurity profiles, graphitic structure, and surface conditions. However, none of those characteristics is fixed by the route label alone. A heavily shaped natural material may look and pack very differently from untreated natural flake. A synthetic material can also be produced with different particle architectures depending on precursor and finishing.
For sourcing, record route and modification as material identity fields. Then compare the measurable outputs: PSD, particle shape, tap density or another packing metric, BET surface area, moisture, selected chemistry, and any other field shown during qualification to affect the process.
The spherical graphite article explains why particle shape, tap density, and PSD must be interpreted together. That is a more reliable basis for comparison than treating “natural” as synonymous with one shape and “synthetic” with another.
Which Performance Metrics Need Side-by-Side Qualification
Performance metrics should be selected from the buyer’s cell objective and evaluated side by side under controlled conditions; no single universal metric can settle the natural-versus-synthetic decision.
The relevant evidence may include first-cycle behavior, reversible capacity, rate response, impedance-related signals, retention over the defined cycle program, swelling, gas behavior, low- or high-temperature response, fast-charge behavior, or another application-specific metric. The article does not assign universal pass thresholds because those values depend on cell chemistry, electrode design, loading, test conditions, and the product being developed.
Use the same electrode and cell protocol for the first comparison wherever practical. If natural graphite is tested at one loading and synthetic graphite at another, or if the binder, conductive additive, calendaring, formation, or electrolyte changes at the same time, the route conclusion becomes weak.
Also separate initial screening from optimization. A candidate may look weaker in a baseline formula but respond differently to process optimization. The team should decide in advance whether the objective is “drop-in replacement under the existing process” or “best achievable performance after route-specific optimization.” Those are different development questions.
| Comparison layer | Keep controlled | What the comparison can tell you |
|---|---|---|
| Powder screen | Methods and sample condition | Whether candidates occupy a comparable material window. |
| Electrode trial | Formula and processing variables | Whether route differences alter slurry, coating, drying, or calendaring behavior. |
| Cell screen | Cell design and test protocol | Whether the candidate supports the required electrochemical function. |
| Repeat-lot check | Qualified process | Whether the supplier can reproduce the approved result. |
Manufacturing Compatibility and Electrode Processing
Manufacturing compatibility can decide between two graphite routes even when both can reach the required cell result, because the factory must reproduce mixing, coating, drying, calendaring, handling, and quality control at scale.
Watch slurry behavior first. Different surface area, morphology, fines, coating, and surface chemistry can change wetting, viscosity, dispersant or binder demand, mixing energy, and storage stability. A powder that looks acceptable in a small batch may expose different process sensitivity at a larger scale.
Coating behavior comes next. The relevant observations can include film uniformity, edge behavior, agglomerates, streaks, pinholes, loading variation, adhesion, drying response, and the process window around line speed or solids. These are manufacturing outputs, not properties that can be read directly from a powder COA.
Calendaring adds another layer. Particle packing, shape, mechanical response, and electrode structure can change how the coated layer densifies under the qualified process. Tap density can support interpretation of powder packing, but it should not be treated as a direct substitute for final electrode density. The powder metric and electrode metric belong to different stages.
Handling also matters. Dust, segregation, moisture pickup, feeding behavior, and packaging state can create plant-level differences that are easy to miss in laboratory qualification. If a route change will alter the commercial package or logistics path, include that condition in the scale-up trial.
Scale-up should also preserve the comparison logic. A laboratory result can be distorted if the two candidates are not exposed to the same storage, feeding, mixing volume, coating width, drying history, and calendaring condition. When the process moves from development equipment to pilot or production equipment, repeat the critical observations instead of assuming that a route decision made on small batches will transfer unchanged.
Packaging and logistics can become part of manufacturing compatibility as well. Different powder bulk behavior, moisture sensitivity, or segregation tendency can change how a material arrives at the feeder. If a supplier proposes a different bag, liner, container, or transport condition, record that as part of the supplied state. The buyer is qualifying delivered material, not an abstract powder removed from its handling history.
For troubleshooting, preserve a retained qualified lot whenever practical. If a new natural or synthetic lot causes a slurry or coating change, processing the retained lot beside it under the same conditions is one of the strongest ways to separate a raw-material shift from an equipment, operator, binder, or environmental change.
Lot Consistency, Change Control, and Supplier Qualification
Lot consistency and change control often matter more to production than the best result from one development sample, because an anode program needs a supplier to reproduce the qualified material over time.
Qualification should therefore include more than one production lot where practical. Compare PSD, morphology or surface evidence, BET, packing-related data, moisture, chemistry, and any additional fields linked to electrode performance. Then run the repeat lots through the qualified electrode process rather than assuming a stable COA guarantees stable application behavior.
Supplier change control should identify which changes require notification. For natural graphite, feedstock source, purification, shaping, classification, coating, or blending can matter. For synthetic graphite, precursor, graphitization, milling, classification, surface treatment, and blending can matter. The exact list should be tailored to the qualified material rather than copied mechanically.
A supplier should not be expected to disclose every proprietary production detail, but the buyer does need enough change notification to protect the material definition. The goal is to prevent a silent process change from reaching production after the buyer qualified a different powder.
The graphite anode material qualification guide provides the Stage-Gate structure for powder screening, electrode trials, cell evidence, repeat lots, and locked supplier data.
Note: A second-source qualification is not necessarily a search for an analytically identical powder. It is a controlled demonstration that the alternative material remains inside the buyer’s acceptable material and process window.
Build a Natural-vs-Synthetic Decision Matrix
A useful natural-versus-synthetic decision matrix records the evidence required for the program and scores neither route until comparable data exist. Keep each candidate at the same qualification gate before comparing scores. A powder-screened natural candidate should not be ranked against a cell-qualified synthetic candidate merely because both rows contain numbers; the evidence maturity is different.
| Decision area | Natural candidate | Synthetic candidate | Evidence required |
|---|---|---|---|
| Material identity | Material family, shaping, coating, blend | Precursor route, graphitization, milling, finishing | Supplier material definition and change-control scope |
| Particle architecture | PSD, morphology, packing | PSD, morphology, packing | Comparable methods and retained samples |
| Surface / chemistry | BET, coating, relevant impurities | BET, coating, relevant impurities | Agreed analytical basis |
| Electrode process | Mixing, coating, drying, calendaring | Same controlled evaluation | Process record and failure observations |
| Cell result | Defined test plan | Same defined test plan | Side-by-side cell evidence |
| Repeat supply | Multiple lots and change control | Multiple lots and change control | Lot trend and requalification rule |
Use the matrix differently depending on the program. A drop-in replacement project may put more weight on process compatibility and equivalency. A new cell development may allow route-specific process optimization before the final comparison. A supply-security project may prioritize repeat-lot consistency and second-source flexibility. A cost-reduction project still needs technical gates so a lower material price does not create a more expensive manufacturing problem.
Example: A defensible decision does not say “synthetic graphite has better performance” or “natural graphite has higher capacity” as a universal rule. It says: under this cell design and this controlled process, candidate A met the defined electrode and cell criteria across the required lots, while candidate B did not—or both passed and the remaining decision moved to cost, supply, or manufacturing risk.
For an RFQ, provide QDZRT Graphite with the route family being considered, the current reference material where available, the powder fields already known to matter, the required sample quantity, and the qualification stage. Do not ask for “the best battery graphite.” Ask for a candidate that can enter a defined comparison.
The natural-versus-synthetic choice should remain evidence-based from start to finish. Route history explains where differences can come from. Powder data narrows the candidate set. Electrode processing shows whether the factory can use the material. Cell testing shows whether the material supports the required function. Repeat lots and change control determine whether the decision can survive production.
Before final approval, document which differences are acceptable and which are not. A candidate can differ analytically from the incumbent and still be acceptable if the difference sits outside the process-sensitive fields. Conversely, a seemingly minor change in a field linked to slurry, coating, or cell behavior can justify rejection or requalification. The matrix should therefore preserve the connection between each powder field and the failure mode it is meant to control.
Keep the decision record with the approved supplier specification. Future engineers should be able to see why the route was chosen, which lots were tested, which methods were used, what process was controlled, and what kind of supplier change would reopen the decision. That record is more valuable than a one-line conclusion that one graphite family was “better.”
Where both routes pass, purchasing can then compare commercial factors without confusing them with technical qualification. Price, lead time, capacity, geographic risk, packaging, documentation, and change-control responsiveness may become the tie-breakers, but only after the technical matrix shows that both candidates can reproduce the required process and cell result. This order keeps commercial optimization from weakening the engineering basis of the decision.
The comparison should remain reproducible when the project team changes. Keep the same terminology, methods, and decision fields in later supplier reviews so historical data remain usable.
Decision matrices work best when they include uncertainty explicitly. A blank cell should not be scored as a failure or quietly treated as equivalent. Mark it as “not yet tested,” identify the evidence required, and decide whether the missing result blocks the next gate. This prevents a route from appearing stronger simply because one supplier supplied more marketing data than another. It also keeps the comparison fair when the team is qualifying a second source and historical data for the incumbent are incomplete.
The same discipline applies to cost comparisons. Material price should be compared only after the candidates reach the same technical gate. A lower-cost powder that requires more binder adjustment, slower coating, more scrap, tighter incoming inspection, or repeated requalification may not reduce total manufacturing cost. The decision matrix can include those process consequences as evidence fields without turning them into unsupported universal rankings. The relevant question is what the buyer’s own trial demonstrated under the controlled process.
When the comparison is updated after a new lot or supplier change, keep the previous matrix version. Version history shows whether the decision moved because the material changed, the process changed, or the project objective itself changed.
For a second-source restart after a long gap, record the retained reference lot, equipment and formulation revisions, and any test-method changes before comparing the new candidate. This prevents a material decision from absorbing unrelated changes that occurred while the program was inactive.
References and Sources
- National Standard Information Public Service Platform — GB/T 24533-2019, Graphite negative electrode materials for lithium ion battery. Current Chinese national product reference.