A particle-size report built around one median value can hide the part of a micronized graphite distribution that is actually causing production trouble. D50 describes the midpoint, but it does not show how broad the distribution is, how much coarse material sits above the main population, how much fine material is present, whether the powder is agglomerated, or how the test method converted an irregular particle population into a reported size result.
Industrial formulations process the whole distribution, not an “average particle.” Coarse particles can drive surface defects, blockage, abrasion, or local concentration; fines can change dusting, wetting demand, viscosity, packing, and bulk behavior. The useful purchase question is which part of the distribution can cause failure in this process and how that part will be measured consistently.
China’s current national standard GB/T 19077-2024, Particle size analysis—Laser diffraction methods, is the current laser-diffraction reference and has been in effect since 1 May 2025. For graphite-specific fineness control, GB/T 3520-2024, Test method for fineness of graphite, is also current. These standards do not make one distribution universally correct for every formulation; they show why the measurement basis has to travel with the reported result.
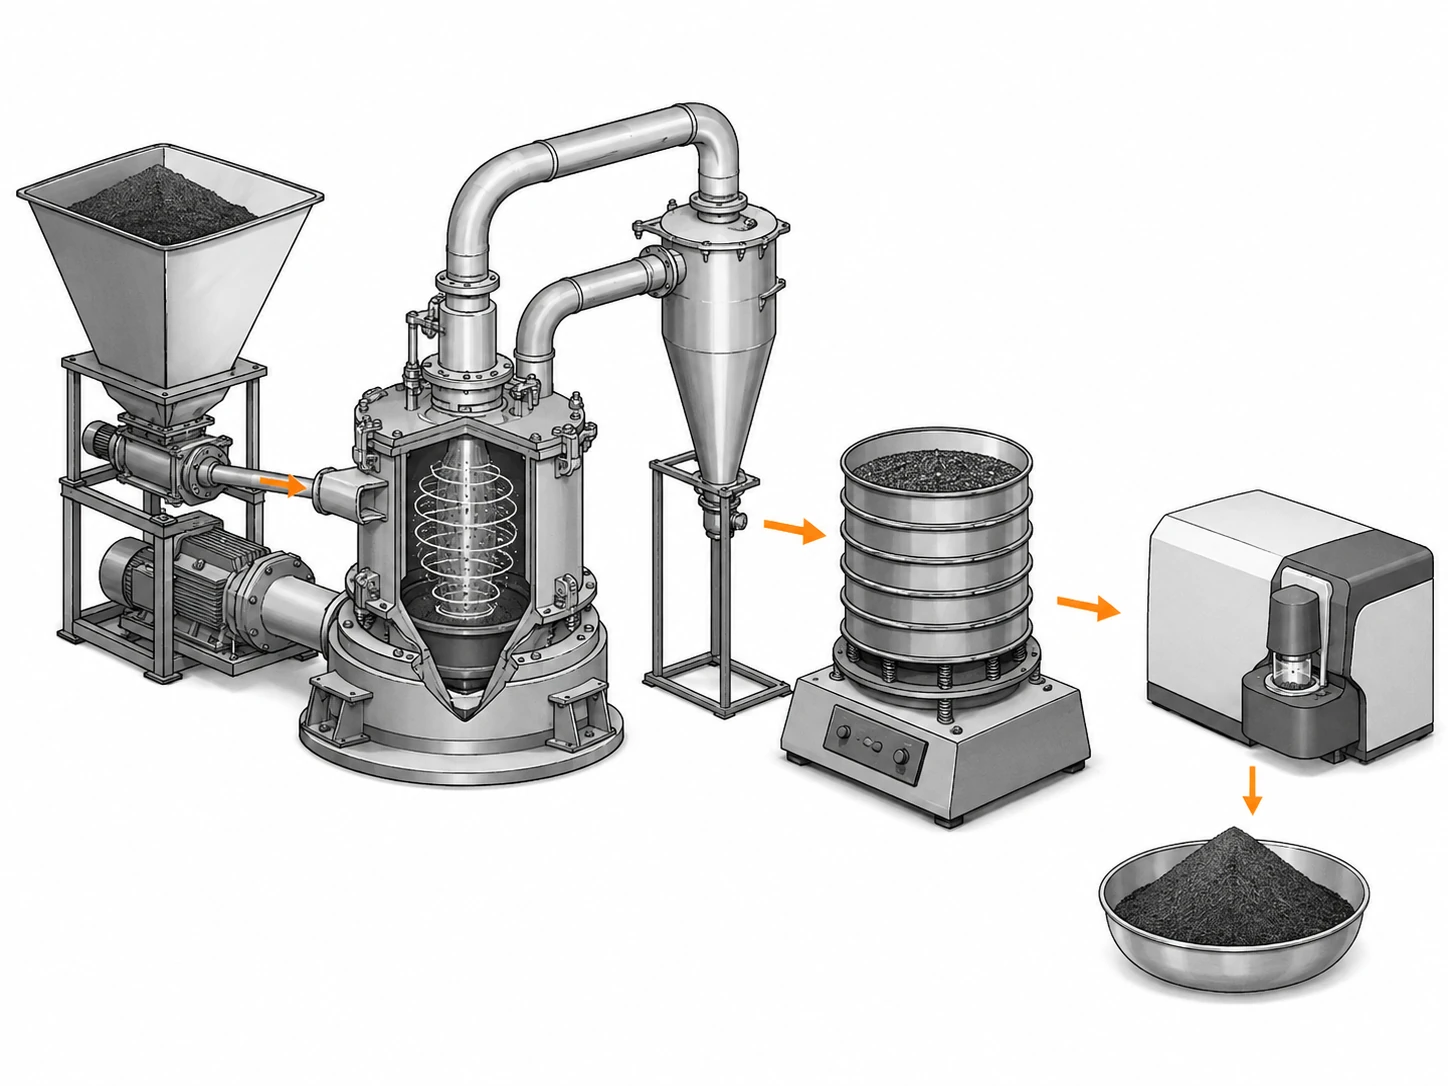
D50 Is a Midpoint, Not the Whole Distribution
D50 is the particle diameter at which half of the reported cumulative distribution lies below that size and half lies above it on the stated measurement basis. It is useful as a central descriptor, but it is not a complete specification for micronized graphite powder.
Consider two distributions with the same D50. One can be relatively narrow, with most particles concentrated near the middle. The other can be broad, with a much larger fine fraction and a longer coarse tail. Both can produce the same midpoint while creating different feeding, dispersion, coating, compaction, and surface results. If the process is sensitive to particles near an upper limit, D50 can remain unchanged while the risk increases substantially.
D50 also does not identify agglomerates by itself. Micronized graphite particles can associate into loose clusters during drying, storage, handling, or sample preparation. A dry powder may enter a measurement instrument as agglomerates unless the test procedure disperses them. A more aggressive dispersion step can break those clusters and report a smaller apparent distribution. The result may be analytically repeatable yet represent a different state from the powder entering the buyer’s production process.
Do not turn one candidate’s D50 into the entire particle-size specification. Use it as one point inside a distribution window, adding D90 or oversize control for coarse-particle risk and a fines metric where small particles affect rheology, dusting, or packing. Keep the measurement method with the limits.
The broader natural versus synthetic graphite powder comparison explains why particle distribution should be evaluated separately from feedstock route, purity, morphology, and bulk behavior. A natural or synthetic label does not remove the need to define the distribution that actually works in the formulation.
Why D90 and the Coarse Tail Matter
D90 gives information about the upper portion of the reported distribution and is often more useful than D50 when a process is limited by coarse particles. It still does not replace the full curve, but it helps the buyer see whether the upper tail is moving while the median remains stable.
Coarse-particle sensitivity appears in different ways. In a thin coating, one oversized particle or agglomerate can project through a film, create a visible defect, interfere with a narrow coating gap, or produce a local region that contains more graphite than the surrounding matrix. In a friction compound, coarse particles may interact differently with other fillers and the contact surface. In a fine screen, nozzle, metering opening, or narrow transfer path, the upper tail can create intermittent blockage even when the average powder appears acceptable.
The correct upper-tail control depends on the process. D90 may be sufficient when the distribution is stable and the measurement method is well correlated with production. In another process, the buyer may need an explicit maximum oversize fraction, sieve residue, or another agreed upper-size control. The important point is to connect the control to a failure mechanism rather than select D90 simply because it is a familiar certificate field.
A change in D90 should also be interpreted with D50 and the rest of the distribution. If D50 remains steady while D90 increases, the change is concentrated in the coarse side. If both move together, the whole distribution may have shifted. If D90 is stable while a fine fraction increases, the process problem may show up as higher liquid demand, dusting, or bulk-density change rather than a coarse-particle defect. The same single number therefore carries different meaning depending on what the neighboring parts of the curve are doing.
For trend review, keep the distribution curve where possible instead of only D50 and D90. A new shoulder, second population, or broader spread can appear before a percentile crosses its limit.
Read the Full PSD Before Linking It to Performance
The full particle-size distribution should be interpreted as a shape, not a list of isolated percentile numbers. The distribution width, tails, shoulders, and multiple populations can indicate changes that a median cannot show.
A narrow distribution may provide predictable surface appearance or controlled packing in one application, but it can also pack differently from a deliberately broad distribution. A broad distribution can sometimes improve packing because smaller particles occupy spaces between larger ones, yet the same fine fraction can raise viscosity or make wet dispersion more difficult. These are competing effects, so the curve cannot be converted into a universal performance ranking without an application trial.
Micronization itself can alter more than size. Milling intensity and classification can change particle shape, edge condition, agglomeration, and the proportion of very fine particles. Those changes can affect how much surface area is exposed to binder, liquid, resin, or other formulation components. A specification that forces a tighter D50 while ignoring morphology may therefore control the wrong variable.
For practical review, divide the PSD into three questions. What happens if the coarse tail grows? What happens if the central population shifts? What happens if the fines increase? Then connect each answer to a measurable process or finished-product result. If the buyer cannot identify a consequence for one part of the curve, that part may not need a tight contractual limit.
| PSD feature | What it can reveal | Possible process consequence to verify | Do not assume |
|---|---|---|---|
| Coarse tail / upper percentile | Oversize particles, broadening, incomplete classification, agglomerates | Surface defects, blockage, local nonuniformity, screen residue | That a lower D90 automatically improves every formulation |
| Central region / D50 | Shift in the main particle population | Changes in packing, incorporation, coating texture, mixing response | That equal D50 means equal powder behavior |
| Fine fraction | More small particles or deagglomerated material | Dusting, wetting demand, viscosity, apparent bulk behavior, dispersion load | That finer is always easier to disperse |
| Curve width or multiple populations | Mixed fractions, process drift, broad classification window | Inconsistent feeding or formulation response | That one percentile describes the whole change |
The graphite powder for conductive coatings guide uses this logic at the formulation level: the relevant PSD is the one that can be dispersed, coated, cured, and electrically verified without creating unacceptable film defects.
The bulk-density and flowability guide treats another consequence of distribution changes—how powder occupies volume and moves through feeding and packaging steps.
Measurement Method and Dispersion Can Change the Reported Result
Particle-size data are only comparable when the measurement method, sample preparation, dispersion state, and reporting basis are sufficiently aligned. A D50 from one method should not be treated as automatically interchangeable with a D50 from another method.
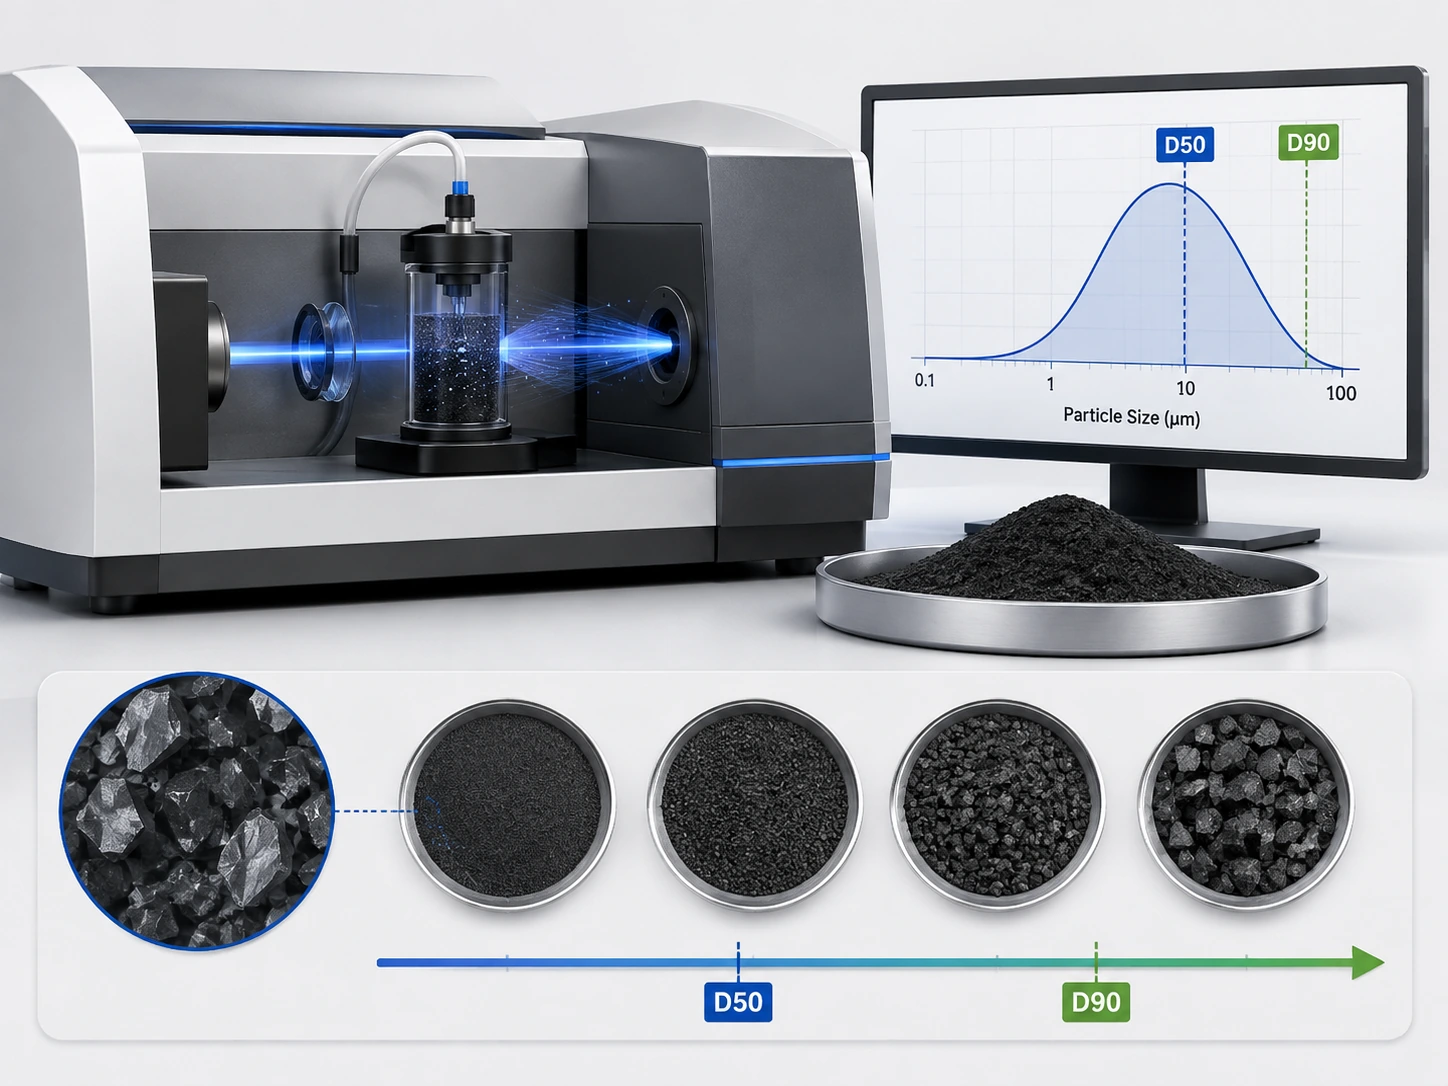
Laser diffraction derives an equivalent particle size from the way a dispersed population interacts with light. Graphite particles are not perfect spheres, and micronized powders can contain platelets, angular fragments, rounded particles, and agglomerates. The reported diameter is therefore a measurement-model result, not a literal measurement of one physical dimension on every particle.
Sample preparation can be just as important as the instrument. Dry dispersion, wet dispersion, dispersant choice, agitation, ultrasound, sample concentration, and the time between preparation and measurement can change whether loose agglomerates remain intact. If one laboratory measures a weakly dispersed sample and another fully deagglomerates it, the distributions can differ even when both laboratories received material from the same lot.
The current GB/T 19077-2024 reference is useful when laser diffraction is the agreed technique, while GB/T 3520-2024 provides a current graphite-specific fineness method where that control is applicable. The purchasing document should identify the method actually used for release rather than mix data from several methods into one tolerance without correlation.
For supplier qualification, record the sample condition, measurement technique, dispersion approach, and the percentiles or fractions used for acceptance. Laboratories do not need identical equipment, but their results must be comparable enough to support the same decision.
Connect PSD to the Actual Mixing, Coating, or Friction Process
Particle-size distribution becomes useful only when it is connected to a real processing or performance result. The same micronized graphite PSD can be acceptable in one formulation and problematic in another because the surrounding matrix, equipment, addition level, and process sequence change the role of each particle fraction.
In a liquid coating, examine wetting, dispersion stability, viscosity, settling, coating gap, film build, cured surface, and the electrical or other functional result. A fine fraction that improves apparent uniformity may also increase liquid demand. A coarse tail that does not matter in a thick coating may become unacceptable in a thin film. The powder should be judged after the formulation reaches its intended dry-film condition, not only while it is being mixed.
In a friction material, PSD must be evaluated together with morphology, ash and trace chemistry, other friction modifiers, binder, fibers, fillers, compaction or molding, and the final friction/wear test. A powder that changes the compound response cannot be ranked from PSD alone. The application-specific article on graphite powder for friction materials therefore treats PSD as one variable inside a larger qualified formula.
In dry feeding and blending, observe hopper discharge, feeder repeatability, dust generation, segregation, and the relationship between mass and occupied volume. A PSD shift can change these behaviors without producing a visible change in the powder label. If production dosing is volumetric, bulk-density variation can magnify the effect.
Use a controlled trial to identify sensitivity. Keep the formulation and process fixed, change one powder variable at a time where practical, and record both the PSD and the process result. If a tighter upper tail eliminates a coating defect, that becomes evidence for an upper-tail requirement. If changing D50 within a reasonable range does not change the process, there is little value in imposing a narrow median tolerance that increases supplier rejection without reducing risk.
Specify PSD Windows Without Over-Controlling the Supplier
A practical PSD specification controls the parts of the distribution that have demonstrated process relevance while leaving the supplier enough room to manufacture a stable grade. The goal is repeatability in use, not the narrowest possible laboratory window.
Start from the qualified lots. Record the method, D50, D90 or other percentiles, any oversize or fines fraction that matters, and the finished-process result. Compare more than one acceptable lot where possible. This shows which variation the process can tolerate. A specification written from one “perfect” sample can accidentally exclude normal material that would perform equally well.
Separate release limits from monitoring fields. Use hard limits only for PSD features linked to acceptance risk; trend the rest until production evidence shows that they predict a meaningful failure.
| Specification field | What to define | Reason |
|---|---|---|
| Material identity | Micronized graphite grade / approved material family and lot identity | Connects sample, COA, delivered lot, and repeat order |
| Measurement method | Laser diffraction, graphite fineness method, sieve control, or another agreed method | Makes repeated results interpretable |
| D50 | Qualified central range only if process-sensitive | Controls the main population without pretending it defines the whole PSD |
| D90 or upper-tail control | Qualified upper percentile, oversize, or residue limit where needed | Controls coarse-particle failure modes |
| Fine-fraction control | Lower percentile or defined fraction only when proven relevant | Controls dusting, wetting, viscosity, or packing sensitivity |
| Sampling basis | Lot, sample location, preparation, and retained sample where appropriate | Reduces false differences caused by segregation or poor sampling |
| Change notification | Process or grade changes that require review or requalification | Protects a qualified formulation from silent distribution changes |
When reviewing an incoming PSD, ask four questions before accepting or rejecting the lot: Is the measurement method the same as the qualification basis? Has the coarse tail changed? Has the fine fraction changed? Does the change cross a limit that was linked to an actual process or product failure? Those four questions are more useful than comparing D50 alone with a target value.
If the buyer is still developing the specification, send the current powder data, formulation type, mixing or coating process, known screen or gap constraints, feeding method, and the failure mode that triggered the review. That information allows QDZRT Graphite to discuss an appropriate powder range without turning an unproven laboratory preference into an unnecessarily tight purchase requirement.
References and Sources
- National Standard Information Public Service Platform — GB/T 19077-2024, Particle size analysis—Laser diffraction methods. Current Chinese national laser-diffraction reference; implemented 1 May 2025.
- National Standard Information Public Service Platform — GB/T 3520-2024, Test method for fineness of graphite. Current Chinese national graphite-fineness test standard; implemented 1 May 2025.